
Optical Illusion Science Fair Projects: 8 Ideas That Work
Optical illusions make great science fair projects because you can measure them. Here are eight ideas with a real question to test, what to change, what to measure and how to turn the results into a clear display.
Why illusions make great projects
Many science fair projects with optical illusions stop at "Look, it fools people!" That makes a nice poster, but judges want to see an experiment: a question, something you change, something you measure and a conclusion drawn from your data. The good news is that illusions are perfect for this. Most of them can be turned up or down by changing one part of the picture, and you can measure how strongly people are fooled with a ruler, a stopwatch or a simple rating scale.
Before you pick an idea, read about the main types of optical illusions so you can explain which family yours belongs to. For the science behind why illusions happen at all, see our guide to why optical illusions work.
The recipe for a strong illusion project
Every idea below follows the same pattern, which is the scientific method in plain words.
- Question: one thing you want to find out, such as "Does the angle of the fins change how long the line looks?"
- Hypothesis: your best guess at the answer, with a reason.
- Independent variable: the one thing you change on purpose (the fin angle).
- Dependent variable: the thing you measure (how long people think the line is).
- Controlled variables: everything you keep the same (screen, distance, lighting, instructions, time allowed).
- Trials: repeat each test several times with several people, then average the results.
Two habits make your data much stronger. First, show the versions in a mixed-up order for each person, so that tiredness or practice does not always land on the same version. Second, include a control: a version with no illusion, such as plain lines with no fins, so you can see how accurate people are when nothing is tricking them.
8 optical illusion project ideas
1. Do fin angles change the Müller-Lyer illusion?
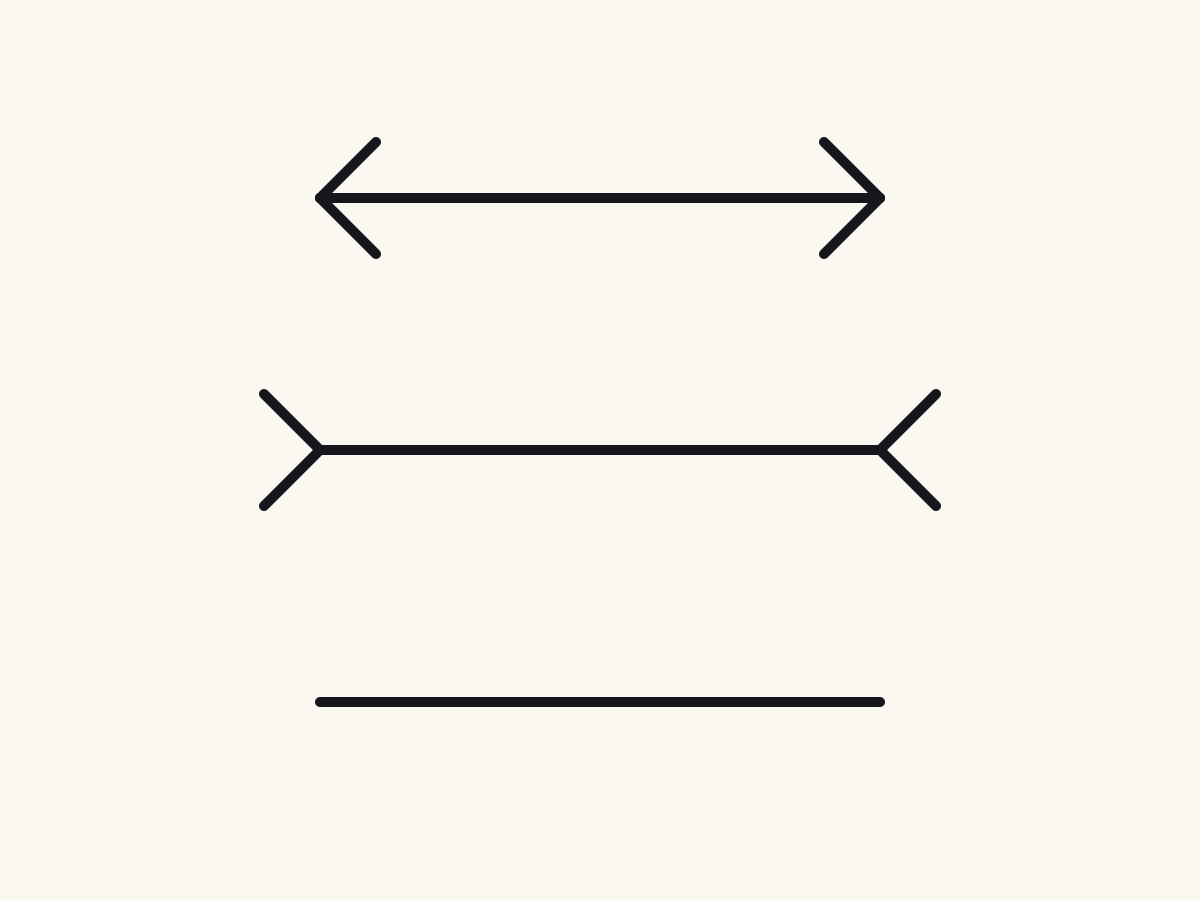
In the Müller-Lyer illusion, a line with outward fins looks longer than an equal line with inward arrowheads. Draw several versions with different fin angles, or different fin lengths. Ask each person to adjust or mark a plain line until it matches the length they see, then measure the difference in millimeters. Our page has an adjustment test that records how far off you are, which is handy for practice. Graph fin angle against the size of the error.
2. Does the size of the neighbors matter?
In the Ebbinghaus illusion, a circle surrounded by big circles looks smaller than the same circle surrounded by small ones. Print a center circle with rings of neighbors in three or four sizes. Ask people to pick, from a row of plain circles, the one that matches the center circle. Does the effect grow as the neighbors get bigger? Does the gap between the center and its neighbors matter?
3. How long does an afterimage last?
Stare at the colored flag on our afterimage flag page and then at white space, and you see the flag in the opposite colors. Change how long people stare (for example 10, 20 and 30 seconds) and use a stopwatch to time how long the afterimage stays visible. Let eyes rest for a minute or two between trials so one test does not spill into the next. Our guide to why colors trick your eyes explains the cone cells behind it.
4. How fast do things fade?
In Troxler fading, a blurry shape in the corner of your vision disappears if you keep your eyes perfectly still on a center dot. Time how long it takes to fade. Then change one thing: how blurry the edge is, how far the shape is from the center, or its size. Many people find that soft, blurry shapes fade faster than sharp ones; your data will tell you whether that holds for your group.
5. Does a longer stare make a stronger motion aftereffect?
Watch the spinning motion aftereffect spiral for a set time, then look at something still, and it seems to move the opposite way. Change the watching time (15, 30 and 60 seconds) and time how long the aftereffect lasts. This is the same "waterfall illusion" scientists have studied since 1834.
6. Does knowing the answer break the illusion?
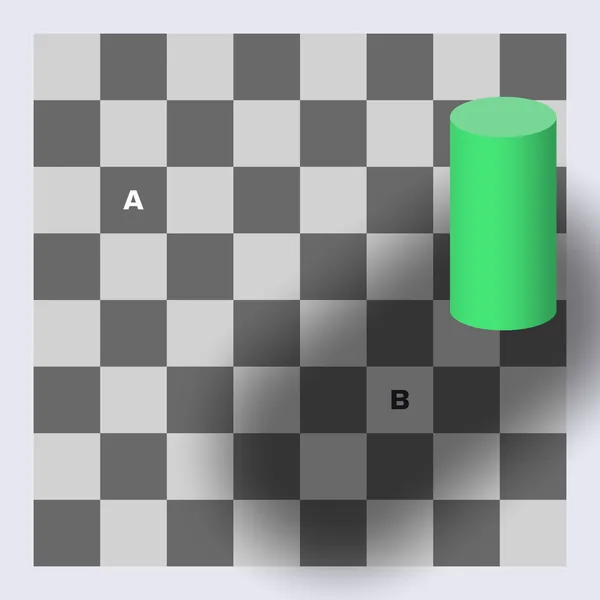
Show the checker shadow illusion and ask people which square is darker. Then show them the proof that the two squares are the same gray and ask again. Do they still see a difference? Rate it on a 1 to 5 scale before and after. Most illusions keep working even when you know the trick, which is a fascinating result to explain on your board.
7. How long does it take to see a stereogram?
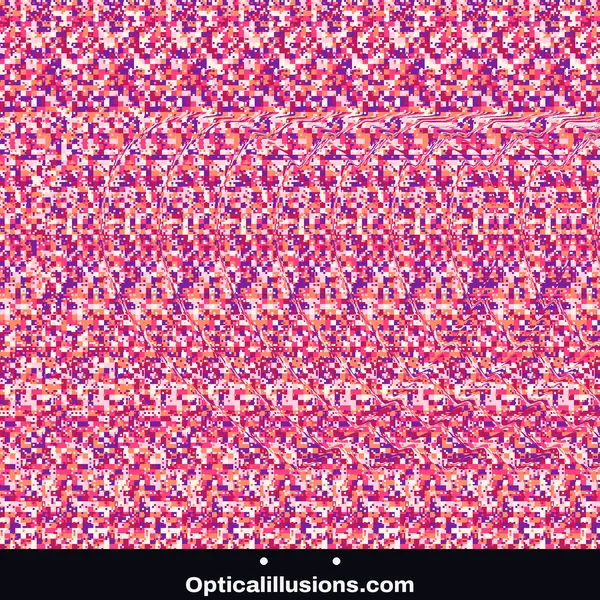
Use a stereogram and time how long it takes each person to see the hidden shape, then test a second picture. Do people get faster with practice? Does the size of the picture or the viewing distance matter? For a twist, make your own test pictures with the Weather 3D tool: type in different ZIP codes to get different hidden temperatures, and use the Show answer button to check each person's answer. Record people who cannot see any shape as a separate group rather than leaving them out, since some people's eyes cannot combine the two views. Our guide on how Magic Eye pictures work explains why.
8. Does screen brightness change motion in a still picture?
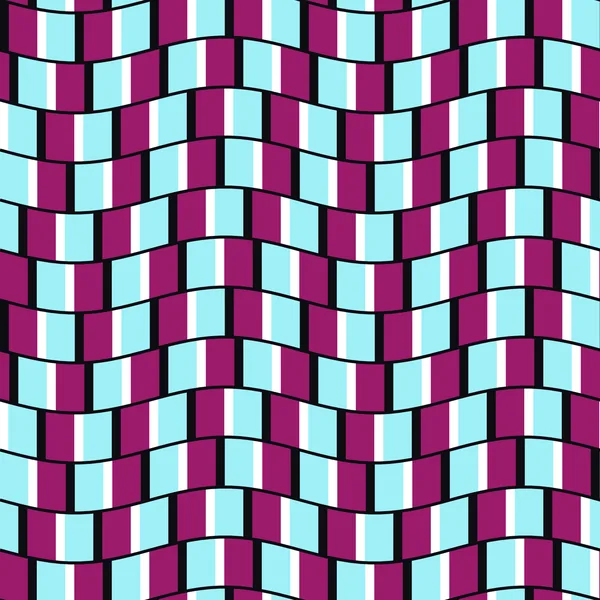
The peripheral drift illusion makes a still pattern seem to creep in the corner of your eye. Show it at three screen brightness levels and ask people to rate how strongly it moves on a 0 to 5 scale. Keep the distance and the time the same. Our article on why still pictures seem to move explains the timing trick behind it.
Getting good data
A few careful choices separate a winning project from a guess.
- Use enough people. More participants make your averages more trustworthy. Ask your teacher how many is realistic for your fair.
- Give the same instructions every time. Write them down and read them word for word.
- Hide the answer until the end. If people know the lines are equal, they may adjust their answers.
- Record everything, including results that surprise you. An unexpected result, honestly explained, often impresses judges more than a perfect one.
- Show your numbers. Use a bar graph or line graph for averages, and include a table of your raw data.
Check your fair's rules first
If your project asks other people to look at pictures, answer questions or be timed, many science fairs treat it as research with human participants. Fairs that follow the Society for Science international rules require a review board to approve this kind of project before you start collecting data, and participants (or their parents, for anyone under 18) must agree to take part. The rules are on the Society for Science human participants page. Local school fairs often have simpler rules, so ask your teacher early.
For safety, skip flashing or flickering images, which can be a problem for people with photosensitive epilepsy, and let anyone stop at any time if they feel dizzy or their eyes get tired.
Making your display board
Lead with a big, simple version of your illusion so visitors can try it as they walk up. Put your question at the top in large letters. Then show your method with photos or small drawings, your graph in the middle, and a short conclusion in plain words: what you found, whether it matched your hypothesis and why you think it happened. A small "try it yourself" card with the illusion printed on it is a great way to get people talking.
Teachers and parents can find free printable worksheets on our optical illusions for kids page, and classroom packs on the For teachers page. To warm up, take our optical illusion test and see how many of these illusions fool you.
Try it yourself
Pick the illusion that surprised you most, then choose one thing to change. That single change is the heart of your experiment.
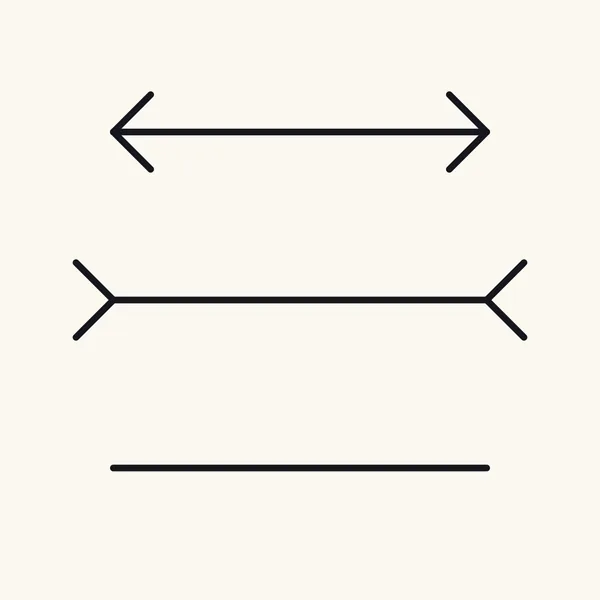 InteractiveGeometric illusionsMüller-Lyer IllusionThree identical lines that look clearly different in length.
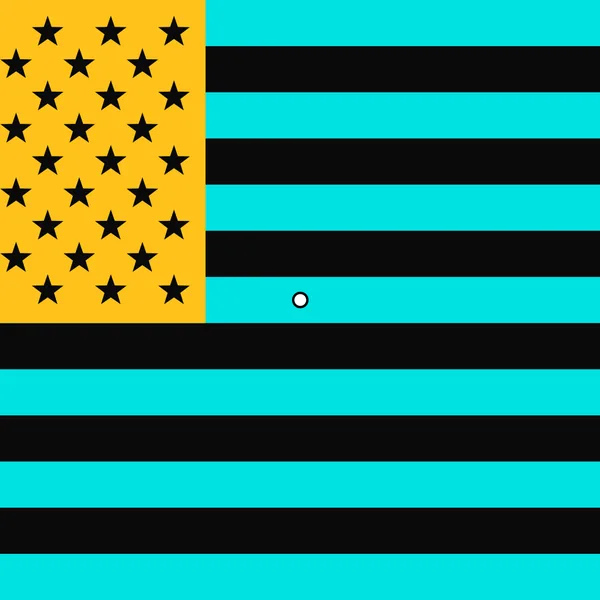 InteractiveColor illusionsAfterimage FlagStare at a cyan, black and yellow flag and a red, white and blue one appears.
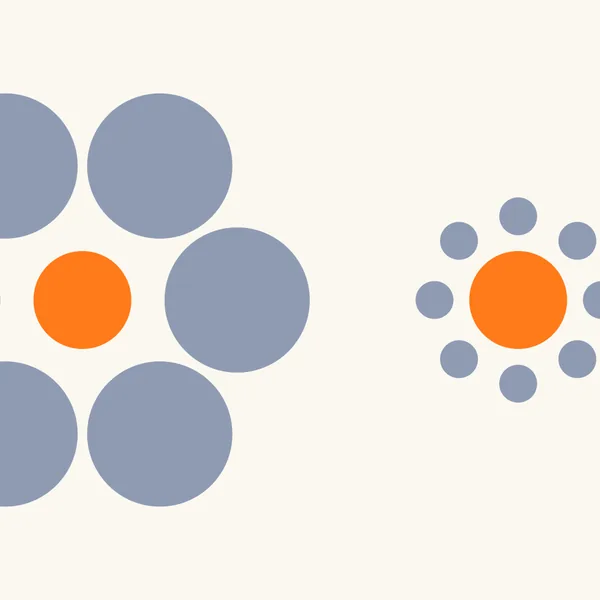 Geometric illusionsEbbinghaus IllusionA circle among giants looks small; among dwarfs it looks big.
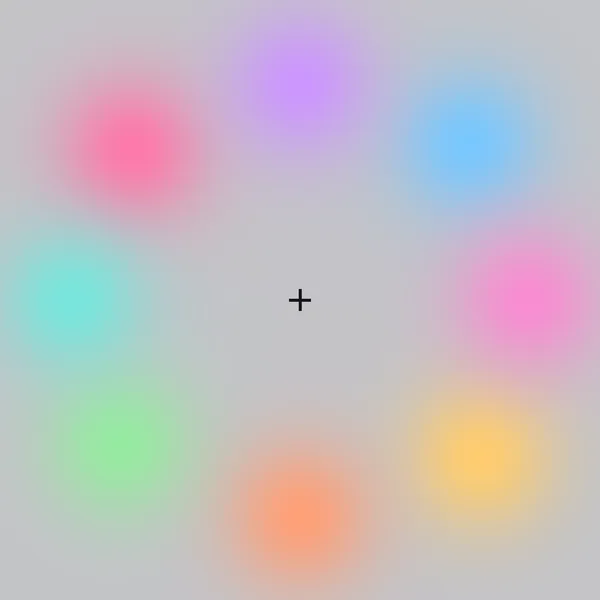 InteractiveMotion illusionsTroxler FadingStare at the cross and the soft color spots vanish into gray.
Questions and answers
What is a good optical illusion science fair project?
A good project changes one part of an illusion and measures the result. For example, change the fin angle in the Müller-Lyer illusion and measure how far off people's length guesses are, or change how long people stare and time how long an afterimage lasts.
What is the independent variable in an optical illusion experiment?
It is the one thing you change on purpose, such as fin angle, stare time, picture size or screen brightness. The dependent variable is what you measure, such as length error in millimeters or seconds until something fades.
Do I need permission to test people for a science fair project?
Often, yes. Fairs that follow the Society for Science international rules require review board approval before you collect data from people, plus consent from participants and parents of minors. Ask your teacher what your fair requires.
What grade level are optical illusion projects good for?
Simple timing and matching projects work well from about grade 3 up. Older students can add more conditions, larger groups and graphs that compare averages.
Enjoyed this? Get a new illusion every week
One original illusion in your inbox each week, with the science explained in a minute.
Written by the Opticalillusions.com team · Published . Illusion artwork © The Wizard Of Sales, LLC. Spotted an error? Tell us.
More from Learn
Learn · Guide15 Famous Optical Illusions and the Stories Behind ThemFrom the Necker cube of 1832 to the dress of 2015: the famous illusions everyone should know, who made them and why they work. Learn · GuideThe Penrose Triangle and Other Impossible Objects, ExplainedWhy the impossible triangle, cube and fork look solid but could never be built, and how artists fake them in real life.
 Learn · GuideWhy Ambiguous Pictures Flip: The Rabbit-Duck, Rubin Vase and MoreA rabbit or a duck? A vase or two faces? Why two-answer pictures flip, why you never see both, and how to switch on purpose.Learn · GuideAfterimage Illusions: Why You See Colors That Aren't ThereStare, look away, and a ghost picture appears in opposite colors. How afterimages work and why they flip red to cyan and blue to yellow.
 Learn · GuideBlind Spot Test: Find the Hole in Your Vision in One MinuteMake a dot vanish and a broken line repair itself. A one-minute test for the blind spot every eye has, and why you never notice it.
 Learn · Guide9 Easy Optical Illusions You Can Do at HomeA floating finger, a hole in your hand, a rubber pencil and more: nine illusions you can do with things you already have.
 Learn · GuideHow to Draw Optical Illusions: 4 Easy Step-by-Step IdeasFour easy illusions anyone can draw with a pencil, ruler and marker, with step-by-step pictures and the science behind each trick.
 Learn · GuideWhat Is Op Art? Optical Illusion Art ExplainedPaintings that ripple, bulge and buzz: how 1960s op artists used lines, grids and color to trick the eye, and how to make your own.Learn · GuideAre Optical Illusions Bad for Your Eyes? Facts and MythsDo illusions hurt your eyes? The facts on eye strain and dizziness, who should take care with flashing patterns, and the viral myths.
 Learn · GuideWhy Do Optical Illusions Work? How Your Brain GuessesSeeing is a best guess. The six shortcuts your brain uses, and the illusions that catch each one, explained in plain words.
 Learn · GuideHow Magic Eye Pictures Work (and How to See Them)The science of hidden 3D pictures, from a 1959 lab experiment to the 1990s craze, plus a step-by-step way to see the shape.
 Learn · GuideWhy Do Still Pictures Seem to Move? Motion Illusions ExplainedDrifting snakes, wobbling checks and spinning rings: how your eye movements and motion cells turn flat pictures into motion.
 Learn · GuideTypes of Optical Illusions, Explained (With Examples)Literal, physiological and cognitive illusions, plus motion, color, geometric, ambiguous, impossible and afterimage illusions, with an example of each.
 Learn · GuideWhy Colors Trick Your Eyes: The Science of Color IllusionsColor constancy, simultaneous contrast, the Munker illusion and afterimages: how your brain builds color, and why it sometimes gets it wrong.
 Learn · GuideThe Dress: Why Everyone Saw It DifferentlyBlue and black or white and gold? The 2015 photo, the lighting assumptions behind it and what scientists found when they studied it.